
Once you go live with Commerce7, you'll gain access to compare your DTC sales, tasting room, and club performance against peers of similar size or region.
In this article
How are wineries grouped for comparison?
What is it?
- Peers Reporting helps wineries understand how their performance compares with the market - not just how their own numbers change over time.
- You compare against a selected peer group, and against the top 10% and top 25% of wineries in it, so you know both where you stand and what's achievable.
- Native to Commerce7, no exports, no third-party tool, no separate login.
- Peer cohorts are matched by winery size and region.
Why did we build it?
- To help clients see how they compare to similar wineries.
- Built from real wineries, not industry averages. Peer cohorts are matched by size and region, so the comparison actually reflects your world instead of a stale industry-wide average.
How are wineries grouped for comparison?
Tenants are added to the applicable cohorts based on region, club member count, bottle price, or total sales.
| Region | Available Cohorts |
|
United States as a whole
|
|
|
Canada Australia New Zealand South Africa California Oregon Texas Napa Sonoma Central Coast |
|
What Data is presented?
|
Report Type |
Data Displayed |
|
Sales Overview |
|
|
Tasting Room |
|
|
Wine Club |
|
How does it work?
Note that only those with Admin Owner and Admin User permissions will be able to view Peers reports.
- Go to Reports > Peers.
- Choose a Peer Group (this list will populate based on your cohort), Date and Report type.
- Click the View Report button.
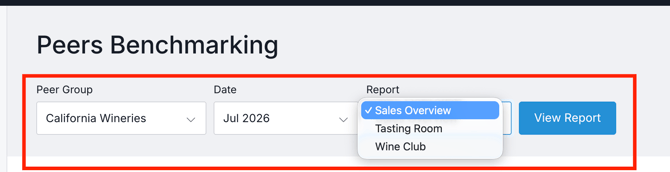
- You'll see both graphs and grids displaying the data.
- While you cannot export, you can print the screen.
Example Reports
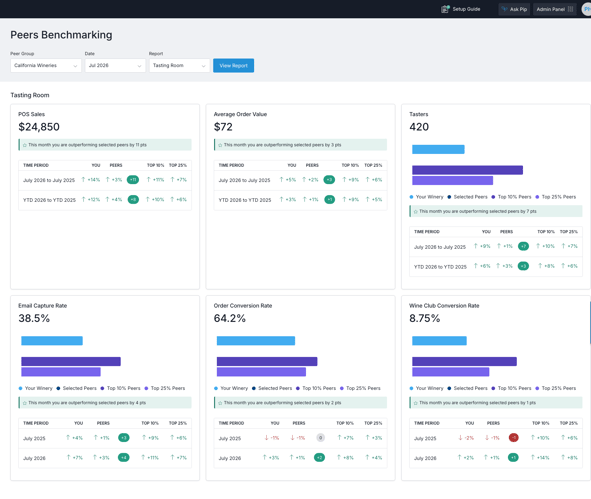
Tasting Room Benchmarking
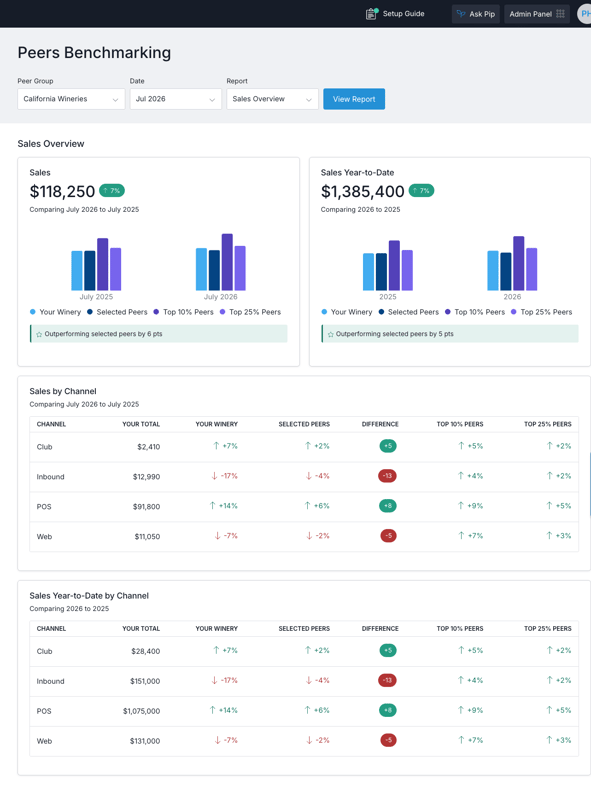
Sales Overview Benchmarking
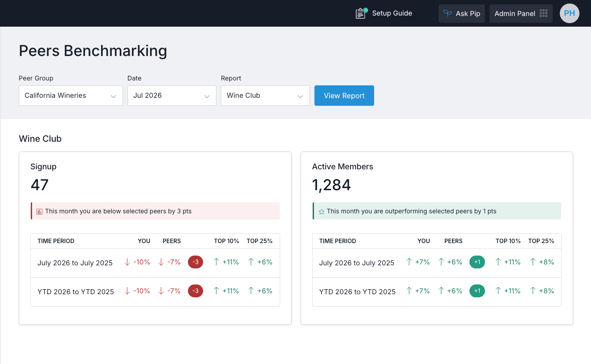
Wine Club Benchmarking
FAQ
What reports are included in Peers Reporting?
Sales Overview, Tasting Room and Club.
How often does the data refresh?
Daily at 5am PST.
Who can access this feature on Commerce7?
Admin Owners and Admin Users.
What countries is this feature available in?
United States, Canada, Australia, New Zealand, South Africa.
What if my winery doesn't have enough peers in its cohort?
You only see cohort(s) you belong to. Some wineries may only have one cohort available; if none apply, it will simply be empty.
How far back can I compare data?
Up to 2 years of historical data from the current month. The date dropdown defaults to the current month (prior month once past the 10th) and sorts most recent first.
How are peer cohorts built?
By region (country and state/sub-region groups, e.g., Napa, Sonoma, Central Coast, Texas, Oregon, plus country-level groups for US, Canada, Australia, New Zealand), club member count, bottle price, and total DTC sales tier. See further detail here.
Can I export or email the report?
No. CSV export and emailing the report are not a part of this initial release.
Can I see how an entire region is performing, not just my own comparison?
Not in this initial release, but it's a possibility in the future.
How large is the peer group used for benchmarking?
The size of the peer group depends on the cohort selected. Cohorts can range from a few dozen tenants to several thousand tenants.
At this time, the number of tenants included in a specific cohort is not displayed within the Peer Report.
Are the Top 10% and Top 25% benchmarks based on absolute performance or growth?
For most metrics, the Top 10% and Top 25% benchmarks are based on percentage growth.
The following metrics are exceptions and are benchmarked using actual performance values rather than growth:
- Email Capture Rate
- Wine Order Conversion Rate
- Wine Club Conversion Rate
If a customer does not process POS transactions through Commerce7, will that affect their benchmarking results?
No. Customers are not penalized if they do not process POS orders through Commerce7.
For POS-specific metrics, tenants with no POS orders are automatically excluded from the benchmark calculations for those metrics.
Can customers choose whether they are included in the Top 10% or Top 25% cohorts?
No. Customers cannot opt in to or out of the Top 10% or Top 25% benchmark groups.
The Peer Report shows the customer's own performance alongside the performance threshold required to be in the Top 10% or Top 25% of the selected cohort.
Are there any additional details about how benchmark data is calculated?
Benchmark data is refreshed nightly to provide up-to-date comparisons and performance thresholds.
As new data is processed, benchmark results and thresholds may change over time.
Are there any other caveats or background details customers should be aware of?
Benchmark comparisons are always based on the selected peer cohort. Cohort sizes can vary significantly depending on the filters and segments used.